



Simply the easiest fundraising and tracking...
Copyright 2024 Jellyware Corporation 6 Castle Harbour Lane, Thornhill, Ontario, Canada L3T 3A2
(647) 793-6544 Email: info@jellyware.net
(647) 793-6544 Email: info@jellyware.net


























Home
Analysis
Donation Statistics
Tabular Statistics
- Click for Video TourRecency Frequency Monetary (RFM) Analysis
- Video Tour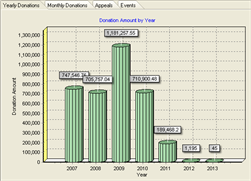
•
Quick visual representation of donation amount by year/month, per appeal/event
•
Plot using donation date or receipt date, selectable cutoff date
•
Ability to Save to File or Copy to Clipboard
•
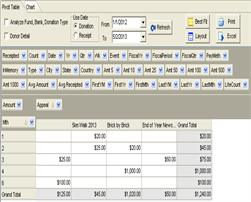
Uses Pivot Table technology to mine data
•
Drag and drop fields to generate a personalized table
•
Take a data field and break it down by week, month, year on one axis,
by event/appeal on the other axis
by event/appeal on the other axis
•
Adjustable date range, layout and best fit options, chart customization
•
Several diagram types: Bar, Line, Area, Pie etc.
•
Graph your results in one click
•
Print or export to Excel
•
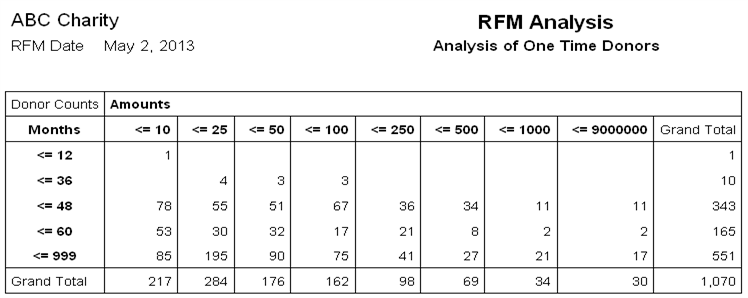
Used to segment donors within periods of months (recency) that have life amounts within ranges (monetary) and have given a certain number of times (frequency).
•
Periods in Months, Life Amount intervals and min and max gift counts are adjustable
•
Multiple RFM analyses can be created and stored
•
RFM Report (shown below) can be printed and selected donor segments can be exported to Excel